Framekit templates
Start from a designer-made template
 Use template
 Use template
 Use template
 Use template
 Use template
 Use template
 Use template
 Use template
Consulting is one of the few professions where the presentation is not a summary of the deliverable. It is the deliverable.
The client pays for a document they will forward internally, quote in a board meeting, and open again in eighteen months to check what you actually recommended.
That changes what consultants need from presentation tools completely. You do not need beautiful transitions.
You need charts that hold up under scrutiny, a file the client can keep and edit, consistency across everything three different people in your firm produced, and the ability to reuse the framework slide you have redrawn forty times.
A consulting deck is a client deliverable in slide form, combining analysis, frameworks, and recommendations into a document that has to survive being forwarded, quoted out of context, and reopened long after the engagement ends.
The best presentation tool for consultants in 2026 is Microsoft PowerPoint, because it is the format every client organisation already opens and edits, its Excel-backed chart engine handles the analysis work properly, and Microsoft 365 Personal costs $99.99 a year.
The trade-off is that PowerPoint gives you nothing for firm-wide consistency, so three consultants produce three visual identities unless you build and police a template.
Beautiful.ai is the fix for that, Pitch is the pick for reusable slide libraries plus per-recipient tracking, Google Slides is free and better for co-editing with a client, and Framekit Slides is a cheap home for proposals and capabilities decks at a small firm, though its PowerPoint export is picture-based and not editable.
Full disclosure: Framekit is our own product. It has since shipped Slides and now ranks sixth, below PowerPoint, Google Slides, Canva, Beautiful.ai and Pitch, because clients cannot edit its picture-based .pptx export. We reviewed it from its features and published pricing, not the same hands-on build.
Re-verified on 19 September 2026 for Framekit's features and prices; competitor prices are as published in August 2026.
How We Compared These Presentation Tools for Consultants
We built the same deliverable in every tool: a forty-five-slide market-entry report with an executive summary, a two-by-two framework, a competitor matrix, six charts including a waterfall and a stacked bar with a secondary axis, a five-year projection table, an implementation roadmap, and an appendix.
Alongside it we built a twelve-page proposal. The carried scenario is a three-person strategy consultancy running about twenty engagements a year.
Chart credibility. Not whether the tool makes charts, but whether it makes the specific charts consultants need: waterfalls, Gantt roadmaps, and stacked bars with a secondary axis, without manual drawing.
The handover. Whether the client receives something they can open, edit, and reuse. In consulting this is contractual as often as it is convenient.
Firm-wide consistency. Whether three people produce one visual identity, and how much policing that requires.
Reuse. Whether the framework slide you drew in engagement four can be dropped into engagement nineteen without redrawing it.
Cost for three people a year, at annual rates.
We keep three kinds of claim apart. Measured by us: the nine builds, the chart tests, the handover tests with a recipient outside our organisation, and the reuse tests, in August 2026.
Verified from published sources: every price below, from each vendor's own pricing page, linked where the number matters. Reported as sentiment: recurring themes in public reviews, always labelled as such.
What Building One Consulting Deck Nine Times Showed
The results split the category into tools that understand analytical charts and tools that do not, and the gap is much larger than any template library.
- 2 of 9 produce a waterfall chart without manual drawing. This is the single biggest capability gap in the category.
- 6 of 9 hand the client a file they can edit. The other three hand over a link or a flattened export.
- 4 of 9 have a genuine reusable slide library rather than a template you copy and diverge from.
- Cost for three people ranged from $0 to $1,440 a year, with the median at $432.
- 3 of 9 report which sections a specific recipient read.
- Only 1 of 9 does secondary-axis and Marimekko charts natively, and it is an add-in rather than a presentation tool.
Presentation Tools for Consultants Compared
The weighting behind the ranking: handover and client compatibility 25%, charts 25%, consistency 20%, reuse 15%, cost 15%.
Charts and handover together carry half, because in consulting a chart that cannot be checked and a file the client cannot open both undermine the engagement in ways a design flaw does not.
| Tool | Client can edit the file | Waterfall and Gantt charts | Reusable slide library | Cost, 3 people / year |
|---|---|---|---|---|
| PowerPoint | Yes, natively | Manual, or via add-in | Slide masters only | $199.99 (Family, 6 seats) |
| Google Slides | Yes | Manual | No | $0 |
| Canva | Yes, via export | No | Brand Kit and folders | $900 (Teams) |
| Beautiful.ai | Yes, via export | Partial | Yes, shared library | $1,440 (Team) |
| Pitch | Yes, via export | No | Yes, components | ~EUR 540 |
| think-cell | Yes, inside PowerPoint | Yes, natively | Not applicable | Quoted per user |
| Storydoc | No slide export | Basic | Yes, templates | $712.80 |
| Gamma | Weak export | Basic | Partial | $324 |
| Framekit Slides | No, .pptx is pictures | Roadmaps yes, waterfall no | No, shared theme only | $180 (Pro, 3 members) |
Framekit's cost is Pro billed yearly, per Framekit's pricing page. On our weighting it scores 2 out of 10 on handover, its lowest mark, against 9 on cost.
1. Microsoft PowerPoint: The Best Overall Choice for Consultants
Best foressentially every consultant whose deliverable is handed to a client organisation.
There is a reason consulting runs on PowerPoint and it is not inertia. The client can open it, edit it, extract three slides into their own board deck, and reopen it in five years.
Every other consideration in this comparison is secondary to that, because a deliverable the client cannot use is a deliverable that gets rebuilt by someone junior at the client, badly, with your name on it.
The chart engine is the second reason. Charts are backed by Excel, so a stacked bar with a secondary axis behaves properly, the underlying data travels with the file, and a client who wants to check your numbers can. In consulting that auditability is worth more than aesthetics.
The real numberMicrosoft 365 Personal is $99.99 a year and Family covers up to six people for $199.99, which is about $33 per consultant per year and the cheapest paid option in this comparison by a wide margin.
The standout detailfont embedding. A licensed brand typeface travels inside the .pptx and renders correctly on a client machine that has never seen it.
Canva, Google Slides, and Keynote all substitute silently instead, which is how a firm's carefully chosen typeface becomes Calibri in the client's copy without anyone noticing.
The gotchait gives you nothing for consistency. Slide masters control layout inheritance and not content, so three consultants working from the same template will produce three slightly different decks within a month, and the only fix is a person whose job is to police it.
Skip it ifyour firm has no capacity to maintain a template. You will end up with drift and no tooling to catch it.
What reviewers say elsewherePowerPoint holds a 4.6 out of 5 across more than 30,000 reviews on G2, where compatibility is the dominant reason cited for continued use.
Verdict: the correct default for consulting and the least interesting answer in this comparison. Buy Microsoft 365 Family, spend the difference on think-cell or a designer, and stop debating it.
2. Google Slides: Best for Working Alongside the Client
Best forengagements where the client is a co-author rather than a recipient.
Some consulting is done with the client rather than for them, and in those engagements Google Slides removes friction that nothing else does.
The client's team can comment without an account, three people can edit at once with no file locking, and version history is granular enough to show exactly which recommendation changed after the steering committee.
The real numberfree at any team size. Google Workspace Business Starter at $7 per user a month adds a firm domain and admin controls, which is $252 a year for three and is optional.
The standout detailcharts inserted from Google Sheets stay linked, so a monthly performance deck refreshes rather than gets rebuilt. For retained engagements with recurring reporting, that removes hours every month.
The gotchait has no font embedding and a low visual ceiling. For a firm whose positioning depends on looking more considered than the competition, a Google Slides deliverable starts at a disadvantage that good content only partly recovers.
Skip it ifthe deck is the sample of your firm's rigour and polish.
Verdict: free, excellent for collaborative engagements, and visibly plainer than the alternatives. The linked-Sheets charts are the underrated reason to use it for retainers.
3. Canva: Best for Consultants Without a Designer
Best forsmall firms whose decks look homemade and whose clients notice.
Canva's argument in consulting is narrow and real: it raises the visual floor for people who are not designers.
Our forty-five-slide report looked more considered in Canva than in PowerPoint, particularly the section dividers, the executive summary layout, and anything involving an image.
Brand Kit is the other reason. Locking fonts, colours, and logos across a small firm is the consistency mechanism PowerPoint lacks, and it works without anyone policing it.
The real numberCanva Pro is $144 a year for one person, and Canva Teams is $25 per user a month, so three consultants cost $900 a year against Microsoft 365 Family's $199.99.
The gotchathe charts are not good enough for consulting. Canva covers bar, line, pie, and simple scatter, and does not do waterfalls, secondary axes, or Gantt roadmaps.
On a forty-five-slide analytical report, two of our six charts had to be substituted with simpler types, which changes what the analysis can show.
Skip it ifmore than a fifth of your slides are charts. You will end up building them in Excel and pasting images, which breaks auditability.
Verdict: the right pick for design-light, narrative-heavy consulting, and the wrong one for quantitative work. The chart ceiling is the binding constraint, not the price.
4. Beautiful.ai: Best for Consistency Across a Small Firm
Best forfirms where you can tell who made a slide by looking at it.
Beautiful.ai solves the specific problem PowerPoint ignores. Its shared slide library holds approved layouts, and the tool re-balances a row rather than letting someone squash the type to fit a fifth item.
Across our three-person test, we genuinely could not identify which consultant built which section, which was the point.
The real numberPro is $144 a year for one person and Team is $40 per user a month, which is $1,440 a year for three. That is the most expensive option in this comparison and 7.2 times Microsoft 365 Family.
The standout detailthe One-Time Project plan at $45 lets you build a single deck without a subscription, which is a sensible way for a firm to test it on one real engagement before committing.
The gotchaanalytics and the shared library both live on the Team tier, so the version of the product that solves your consistency problem is also the $1,440 one. Pro on its own does not do the thing you would buy it for.
Skip it ifyou work alone. The whole value is coordination.
Verdict: genuinely effective at the consistency problem and priced as though every consultant is a designer. Worth it for firms losing credibility to visual drift, expensive for everyone else.
5. Pitch: Best for Reusable Frameworks and Tracking
Best forfirms who redraw the same framework slide in every engagement.
Pitch's component system is the best answer here to consulting's real inefficiency, which is not making decks but remaking them.
The two-by-two framework, the maturity model, and the implementation roadmap became components, so engagement nineteen started from engagement four rather than from a blank slide.
Advanced links add the other half. On our test send, one recipient read the recommendations section three times and never opened the appendix, which is directly useful before a follow-up conversation.
The real numberPitch charges per seat at EUR 10 for Plus, EUR 15 for Team, and EUR 20 for Business. Three consultants on Team is roughly EUR 540 a year. PowerPoint export starts on Plus and advanced links start on Team.
The gotchathe charts are basic, in the same way Canva's are. For a quantitative deliverable you will be pasting images from Excel, which loses the underlying data the client may be contractually entitled to.
Skip it ifyour engagements are analysis-heavy rather than framework-heavy.
Verdict: the best reuse mechanics in this comparison and a real chart limitation. Strong for advisory and strategy work, weak for anything with a model behind it.
6. Framekit Slides: Best for Proposals and Capabilities Decks on a Budget

Best forsmall and boutique consultancies, especially brand, creative and marketing ones, whose proposals, capabilities decks and methodology pieces sell the work, and whose clients do not need an editable file.
Framekit is an AI website builder that now ships Slides, a deck tool in the same account as the firm's website. It sits sixth, not in the top three, because it fails this page's first test: the handover.
Its .pptx export (Pro and up, up to 60 slides) turns each slide into a picture with speaker notes attached, so a client cannot lift your framework slide into their own deck or check a number behind a chart.
For engagement deliverables, that rules it out. We reviewed it from its shipped features and published plans, not the same forty-five-slide build.
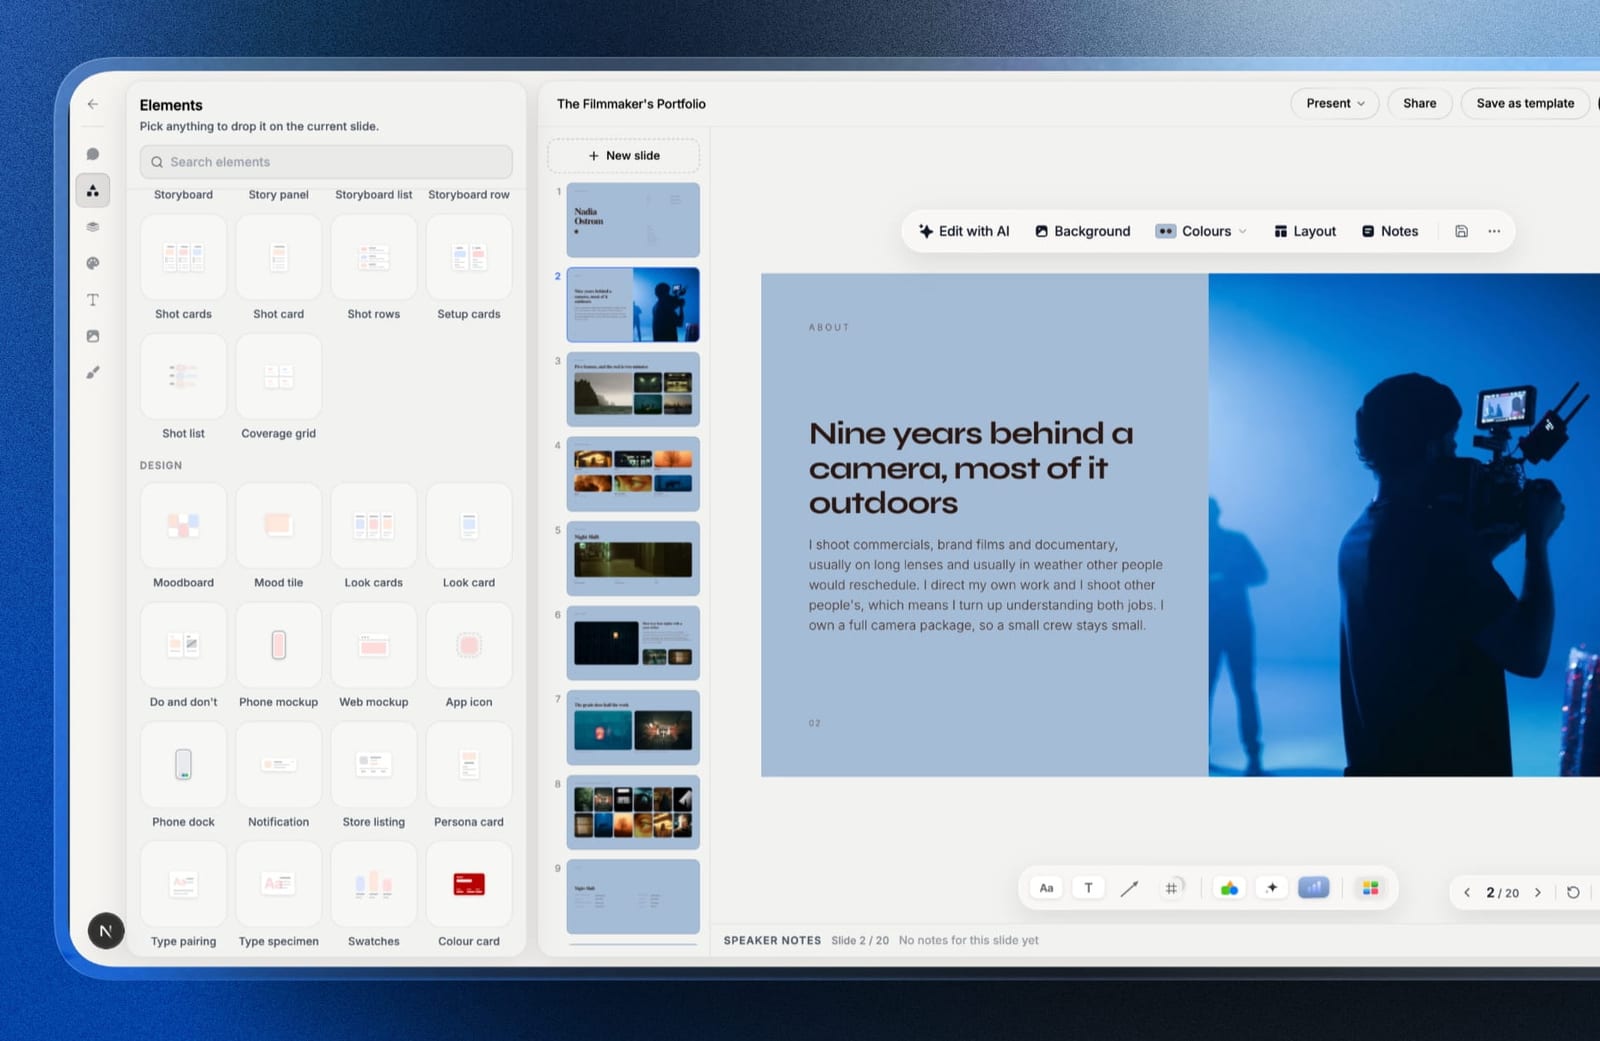
Where it earns a place is the winning-the-work side. You describe a slide and the AI writes and lays it out, with everything editable by hand afterwards.
Charts import from a CSV or .xlsx file and stay editable, including column, stacked bar, line, area and pie charts plus timeline and roadmap layouts, though there is no waterfall and no secondary axis.
Your own fonts and colours apply to every slide on paid plans, and PDF export and a share link are free.
The real number$180 a year for the three-person firm on Pro billed yearly, which includes three team members and PowerPoint export, against $1,440 for Beautiful.ai Team and roughly EUR 540 for Pitch Team. The free plan has unlimited decks.
The standout detailthe proposal deck and the firm's website share one account, so the capabilities page a prospect finds in search and the proposal you send carry the same case studies, fonts and colours without being maintained twice.
The gotchabesides the picture-based export, there is no live co-editing, no reusable slide library, no per-recipient tracking and no password on a deck link.
Skip it ifthe client receives an editable deliverable, your charts include waterfalls or secondary axes, or you need to know who read the proposal. PowerPoint with think-cell, or Pitch, is the right answer there.
Verdict: a good, cheap home for the decks that win work at a small firm, and the wrong tool for the deliverable itself. Start free at framekit.ai/slides.
7. think-cell: Best for Charts Consultants Actually Need
Best forany consultant who has manually drawn a waterfall chart and lost an afternoon to it.
This is the entry most comparisons of this category leave out, and for consulting specifically it is the most valuable tool on the page. think-cell is a PowerPoint add-in rather than a presentation tool, and it produces waterfall charts, Gantt roadmaps, Marimekko charts, stacked bars with proper difference arrows, and CAGR annotations from a spreadsheet, correctly, in seconds.
Our six charts took eleven minutes in PowerPoint with think-cell and roughly ninety minutes drawing the waterfall and roadmap by hand without it.
The real numberthink-cell is licensed per user on an annual subscription with pricing available through their site, and it is meaningfully more expensive per seat than the presentation software it sits inside.
Confirm the current figure directly, since it is quoted rather than published as a simple list price.
The standout detailcharts stay linked to their data, so updating a number in the linked sheet updates the chart, the labels, and the difference arrows together. On a deliverable that goes through three rounds of client revisions, that is the difference between an afternoon and ten minutes.
The gotchait is Windows and Mac PowerPoint only, and it does nothing for Google Slides, Canva, or anything else. Adopting it locks your firm to PowerPoint, which for most consultancies is where they already are.
Skip it ifyour decks are narrative rather than quantitative.
Verdict: the highest return on investment on this page for analytically-driven firms, and irrelevant to everyone else. If you have ever drawn a waterfall by hand, this pays for itself in one engagement.
8. Storydoc: Best for Proposals Read on a Phone
Best forthe proposal that wins the engagement, not the deliverable that closes it.
Consulting has two documents with different jobs. Storydoc is good at the first one. A twelve-page proposal built as a responsive web document reads properly on a phone, plays an embedded intro video, and reports which sections the prospect read before the call.
The real numberStarter is $19 a month or $237.60 a year per seat, so three consultants cost $712.80 a year. There is no free plan, only a trial.
The gotchathere is no slide export at any tier. For the deliverable half of consulting, where the client expects an editable file they can archive, that is disqualifying rather than inconvenient.
Skip it ifyou were hoping to use one tool for proposals and deliverables.
Verdict: a good proposal tool and not a deliverable tool. Worth considering as a second subscription, never as a replacement for the first.
9. Gamma: Best for the First Draft
Best forturning research notes into a structured deck before the analysis is finished.
Gamma took our research summary and produced a sensible forty-section structure in about two minutes. For consultants, the value is not the finished deck but the outline: seeing the argument laid out early tends to reveal the gaps in it.
The real numberGamma Plus is $108 a year per person, so three consultants cost $324, and the free plan is credit-limited rather than feature-limited.
The gotchathe PowerPoint export is the weakest of the nine. Card layouts do not map onto slide geometry, so the exported file arrives with text overflowing frames. For a deliverable that must be a .pptx, this is a dead end.
Skip it ifthe output has to be a file.
Verdict: a drafting tool that happens to produce slides. Use it before the deck rather than as the deck.
The Chart Problem Nobody Prices In
This is the finding that surprised us most, and it is specific to consulting rather than to presentations in general.
Waterfalls and roadmaps are near-universal in consulting and near-absent in presentation software. Of the nine tools, only PowerPoint with think-cell produces a waterfall from data rather than from manually stacked rectangles.
Everywhere else, a waterfall is a drawing that looks like a chart and cannot be updated when the numbers change.
A drawn chart breaks the audit trail. When a client asks where the 14% came from, a linked chart answers and a drawing does not. In engagements where the analysis is the product, that difference has professional consequences beyond convenience.
Pasted images lose the data entirely. The common workaround of building charts in Excel and pasting images means the client receives a deck whose numbers cannot be checked or reused, which some engagement contracts explicitly prohibit.
In one lineif your work is quantitative, the presentation tool matters less than the charting layer sitting on top of it, and choosing a design-first tool quietly costs you the auditability that consulting is sold on.
What Three Consultants Cost Over Three Years
Consulting firms tend to buy software once and renew it indefinitely, so the three-year figure is the honest one.
| Setup | 3 years, 3 people | What it solves |
|---|---|---|
| Google Slides | $0 | Collaboration, at a visible design cost |
| Microsoft 365 Family | $599.97 | Client compatibility, charts, offline, font embedding |
| Framekit Pro | $540 | Proposal and capabilities decks next to the firm's site |
| Gamma Plus | $972 | Fast structural drafts |
| Canva Teams | $2,700 | Visual floor and brand consistency |
| Storydoc Starter | $2,138.40 | Proposals that read on a phone |
| Pitch Team | ~EUR 1,620 | Reusable components and per-recipient tracking |
| Beautiful.ai Team | $4,320 | Enforced firm-wide consistency |
| Microsoft 365 plus think-cell | $599.97 plus licences | Charts that are correct and auditable |
A test that takes one engagement. On your next deliverable, log the time spent drawing charts by hand and the time spent reformatting slides someone else made. Multiply by twenty engagements.
If chart drawing dominates, buy think-cell and stay on PowerPoint. If reformatting dominates, buy Beautiful.ai or build components in Pitch. Most firms guess wrong about which of the two is costing them more.
Which Presentation Tool Should Your Consultancy Use?
The decision turns on whether your work is quantitative or narrative and on whether visual drift across the firm is costing you credibility, so work down these questions in order and stop at the first yes.
1. Do clients receive an editable file as a deliverable? PowerPoint. Almost nothing else survives that requirement intact.
2. Do your decks contain waterfalls, Gantt roadmaps, or secondary axes? PowerPoint with think-cell. No design-first tool does these properly.
3. Does the client's team co-author the deck with you? Google Slides, free, with linked Sheets charts for recurring reporting.
4. Can you tell which consultant made which slide? Beautiful.ai for enforcement, or Canva Teams for a cheaper and softer version of the same fix.
5. Do you redraw the same frameworks every engagement? Pitch, for real components rather than copied templates.
6. Is your bottleneck winning the work rather than delivering it? Storydoc for proposals, kept separate from your deliverable tool.
7. Are your decks narrative rather than quantitative, and does nobody in the firm design? Canva.
8. Is the deck a proposal or capabilities piece that sells the work, with no editable handover, at a small firm on a budget? Framekit Slides on Pro, $180 a year for three.
9. Is the document actually a capabilities or methodology piece that never changes? Publish it as a page on your own site instead of emailing a deck.
Frequently Asked Questions
What presentation software do management consultants use?
Management consultants overwhelmingly use Microsoft PowerPoint, because client organisations can open and edit the file, its Excel-backed charts keep the underlying data auditable, and font embedding preserves brand typefaces on client machines.
Many firms add think-cell, a PowerPoint add-in that produces waterfall, Marimekko, and Gantt charts that PowerPoint cannot create natively.
Is Canva good enough for consulting decks?
Canva is good enough for narrative consulting decks and not for quantitative ones, because its chart engine covers only bar, line, pie, and simple scatter types and cannot produce waterfalls, secondary axes, or Gantt roadmaps.
It raises the visual quality of section dividers and summary layouts substantially, which matters most for firms without a designer.
What is think-cell and is it worth it?
think-cell is a PowerPoint add-in that creates waterfall, Marimekko, Gantt, and stacked charts with difference arrows and CAGR annotations directly from spreadsheet data, keeping them linked so a data change updates the chart.
For analytically driven firms it typically saves more time in one engagement than it costs, and it is irrelevant to consultants whose decks are narrative.
How do consulting firms keep decks consistent across people?
Firms keep decks consistent either by policing a PowerPoint template manually, which is what most do, or by using a tool with an enforced shared slide library such as Beautiful.ai or a component system such as Pitch.
PowerPoint's slide masters control layout inheritance rather than content, so drift is inevitable without a person or a tool preventing it.
Should consultants send a PDF or an editable file?
Consultants should usually send an editable file, because clients extract slides into their own decks and reopen deliverables long after the engagement ends, and some contracts require the underlying chart data.
Send a PDF alongside it when you want a fixed record of what was delivered on a given date.
What is the cheapest presentation setup for a three-person consultancy?
Google Slides is free at any headcount and is the cheapest workable setup, at a visible cost in design quality and with no font embedding.
The cheapest paid option is Microsoft 365 Family at $199.99 a year for up to six people, which is roughly $33 per consultant and includes the full desktop applications.
Which tool shows whether a client read the proposal?
Pitch, Storydoc, and Gamma all report per-recipient engagement, while PowerPoint, Google Slides and Framekit Slides do not, including which sections were read and for how long.
Pitch requires the Team tier at EUR 15 per seat per month for the advanced links carrying this data, and Storydoc includes it from its entry plan at $237.60 a year per seat.
Can you build a consulting deck in Google Slides?
You can build a consulting deck in Google Slides, and the two real limitations are chart depth and font embedding.
Charts cover common types but not waterfalls or secondary axes, and any typeface outside the Google Fonts library substitutes silently on machines that lack it, which quietly changes how your deliverable looks on the client's screen.
PowerPoint vs Beautiful.ai for a small consulting firm?
PowerPoint is better for client compatibility, chart depth, and cost at $199.99 a year for six people, while Beautiful.ai is better at preventing visual drift across a firm through an enforced shared slide library.
Beautiful.ai Team costs $1,440 a year for three seats, so the decision is whether inconsistency is costing you more than that in credibility.
Should a consultancy's capabilities deck be a website?
A consultancy's capabilities and methodology material should be a website rather than a deck, because it is sent unchanged to every prospect, needs to be found in search, and should show the current version to everyone holding the link.
Engagement deliverables should stay as files, since clients archive, edit, and audit them.
Framekit holds both sides for a small firm, the website for capabilities and Slides for proposal decks, but its .pptx export is not editable, so deliverables belong in PowerPoint.
Final Verdict
PowerPoint is the right answer for consulting and it is not a close call. Client organisations open it, the charts are auditable, fonts embed properly, and six seats cost $199.99 a year.
The interesting decision is not which presentation tool to buy but what to add on top: think-cell if your work is quantitative, Beautiful.ai or Pitch if your problem is that three consultants produce three visual identities, and Storydoc if you are losing pitches before the deliverable stage.
Where Framekit losesFramekit Slides is not for consulting deliverables. Its PowerPoint export is picture-based, so clients cannot edit or audit the file, it has no waterfall or secondary-axis charts, no reusable slide library and no per-recipient tracking.
For the engagement itself, PowerPoint with think-cell is the better fit; Framekit's case is the proposal and capabilities deck at a small firm.
The number worth carrying away is the chart one. Only one of nine tools makes a waterfall from data, and if you are drawing them by hand you are spending afternoons on something a linked chart does in a minute.
Related reading: our guides to the best client proposal software, the best sales deck software, the best presentation tools for freelancers, and the best presentation software.
Prices above reflect published vendor rates in August 2026, with the exception of think-cell, which is quoted rather than listed. Confirm current per-seat figures directly before budgeting for a firm.